
What is ERD? Entity Relationship Diagram Types, Symbols & Uses How are entities and characteristics and relationships represented in a database? It is a graphical depiction of the relationships between pieces of information in a database . An entity-relationship diagram That’s why it is used by database designers to help developers, DBAs, analysts and application teams understand the data model before creating tables and relationships.
An ER diagram is a high level examination of a database before SQL tables are created. It also helps groups identify relationships, keys, qualities, and potential design problems early in the development cycle.
What Is ERD?
An ERD is a diagram that illustrates the entities and relationships in a database. It’s basically a diagram of how information is connected and constructed together.
For example, in an online purchase database the entities may be Customer, Product and Order. A customer can have several orders. An order can have many commodities.
The basic idea is to transform business needs into a structured data model. This enables planning the data base and creates a consistent visual language for developers and stakeholders.
What Is An Entity Relationship Diagram Used For?
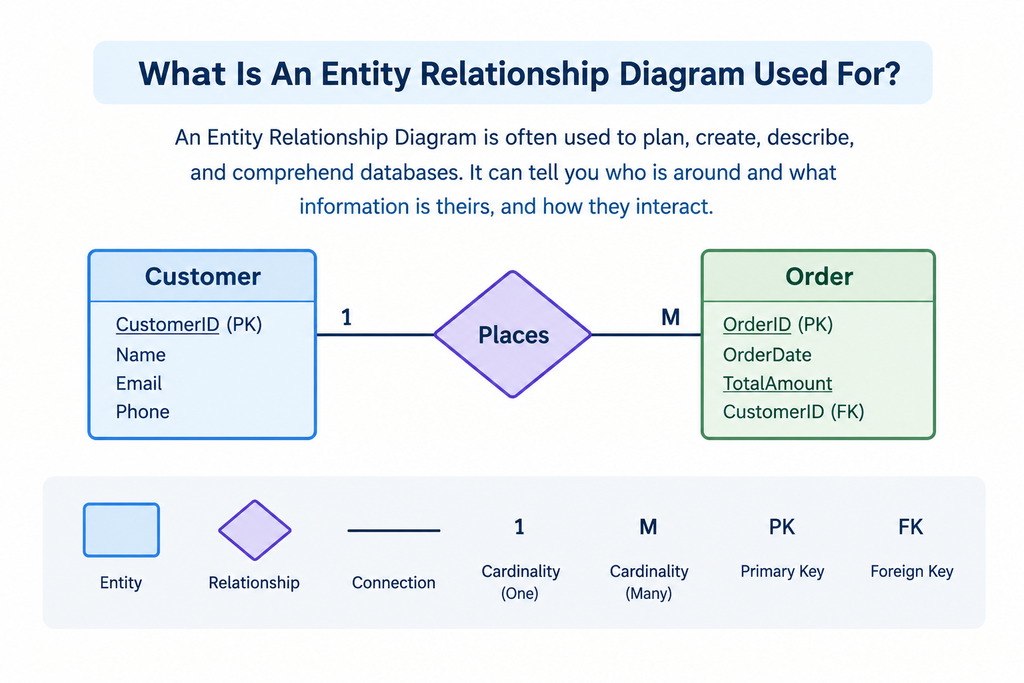
An Entity Relationship Diagram is often used to plan, create, describe, and comprehend databases. It can tell you who is around and what information is theirs, and how they interact.
Typical applications are:
- Planning a new database.
- Understanding an existing database.
- Identifying primary and foreign keys.
- Defining relationships between tables.
- Finding duplicated or unnecessary data.
- Communicating database requirements.
- Supporting database documentation.
- Helping developers convert a conceptual model into tables.
Microsoft says: “Database diagrams can describe tables, columns, keys, relationships and restrictions visually.
ERD Components
An ERD has four basic components: entities, attributes, relationships, and cardinality.
1. Entities
An entity is something about which information is maintained. e.g. Customer, Employee, Student, Product, Order.
In many conventional notations entities are represented as rectangles. In actual database technologies entities are generally represented as table-like structures with columns.
2. Attributes
Attributes are the properties of an entity . Here are some samples of properties for a Customer object: Customer_ID, Name, Email and Phone.
A primary key is a unique identifier for a record. A foreign key is a link from one record to another related entity.
3. Relationships
ERD relationships illustrate the relationship between entities. For instance, a customer places an order.
Relationships can be one-to-one, one-to-many or many-to-many These are also the common relationship types that Microsoft acknowledges when designing database models.
4. Cardinality
Cardinality is how you determine how many records can participate in a relationship.
Examples are:
One-to-one ( 1:1 ) : A person can have just one passport .
One-to-many (1:M): One department can have numerous personnel.
Many-to-many (M:M): Students can be enrolled to several courses and each course can have several students.
What Are ERD Symbols And Their Meanings?
Knowing the ERD symbols makes the diagrams easier to understand.
| Symbol | Meaning |
| Rectangle | Entity |
| Oval | Attribute in traditional Chen notation |
| Diamond | Relationship in traditional Chen notation |
| Line | Connection between components |
| Underlined attribute | Primary key in traditional notation |
| Crow’s foot | Many-side relationship |
In traditional Chen notation, things are shown as rectangles, qualities as ovals, and relationships as diamonds.
Most modern database technologies also employ Crow’s Foot notation. The cardinality of the relationship is shown by the form of the lines and the ends of the lines.
Types Of Entity Relationship Diagrams
There are different sorts of ERDs depending on how much detail you demand for your database.
Conceptual Model
A conceptual model gives a high-level picture of the information system. It mostly has to do with large enterprises and their relations.
Logical Model
A logical model is more detailed, such as properties, keys and relationships. This can be used to improve requirements before physical implementation.
Physical Model
The implementation specifics like as tables, columns, data types, primary keys, foreign keys and other database-specific aspects are modelled physically.
IBM describes three main stages of database modelling which increase in detail: conceptual, logical and physical models.
ERD In DBMS
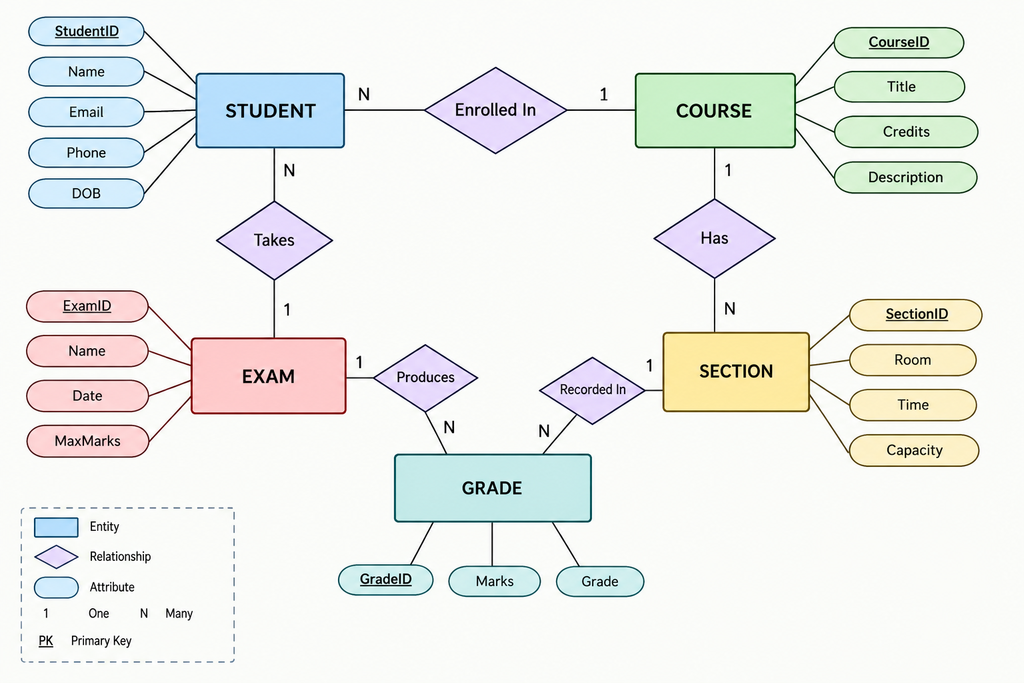
An ERD in DBMS helps to link business needs with database implementation. In DBMS, Entity Relationship Diagram is mainly utilised in conceptual and logical phases of database design.
Ultimately, a database management system will store information in structures like tables. The diagram helps to determine how various structures should relate before its execution.
A Database ER diagram can therefore be a blueprint for constructing tables and defining primary-key and foreign-key relationships.
Microsoft’s database modelling documentation illustrates how relationships link tables via main and foreign keys.
How ERD Works?
To know how ERD works, we can take a basic process:
- Find out what information the application needs.
- Name the big dogs.
- List out the attributes of each entity.
- Choose appropriate primary keys.
- Detect relations between entities.
- Find the size of the relationship.
- Decide on where foreign keys are needed.
- Review for needless duplication of model.
- Convert the model to tables in the database.
- Check the structure of the created database.
This technique allows teams to discover database requirements before developing huge portions of SQL code.
How To Create An ERD?
If you want to know how to build an ERD, begin by considering the needs of the application.
Imagine you are designing a library database. You might identify Book , Member and Loan as significant entities .
Then define fields like Member_ID, Name, Book_ID, Title, Loan_ID, Issue_Date and Return_Date.
Then determine how the entities interact. A member can have many loans, and each loan is tied to one specific book and member.
Finally, select keys and display the relationships in an appropriate manner. There are tools like Microsoft Visio to construct relationship diagrams and database models.
Two Real World Examples
E-Commerce Database
Examples of entities in an online store could include Customer, Order, Product, Payment.
Customer may place more than one order. An order may contain many products . A payment can be associated with an order .
This model allows developers to identify relations between client data, purchases, goods, and payments.
University Database
A university system may have a Student, a Course, an Instructor and an Enrolment.
A course can have many students and a student can be enrolled in many courses. An associative entity such as Enrolment can be used to map the many-to-many relationship and store information like the date of enrolment.
These examples demonstrate the use of visual modelling to clarify complex relationships before database implementation.
Why Is ERD Important In Database Design?
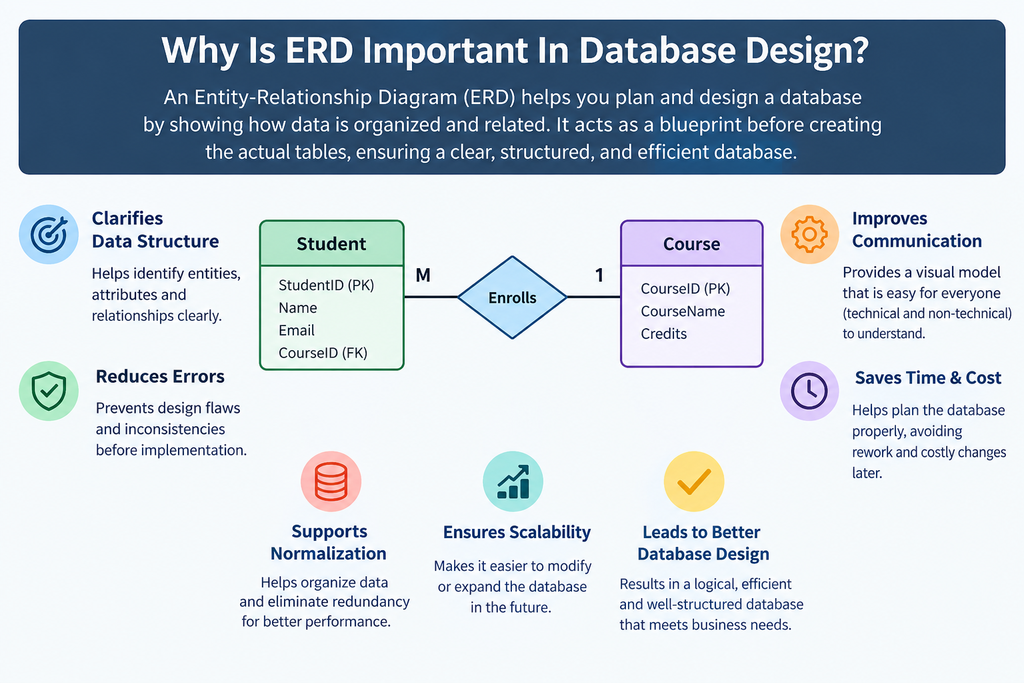
The ERD is particularly important in database architecture because: A solid model can assist teams identify what data they need prior to deployment.
It can assist developers, analysts, database administrators and business teams talk to each other. It can also help to find missing relationships, duplicate information that is not needed and confusing criteria.
You can also display an existing database graphically to assist you understand the structure. Database diagram tools may depict tables, columns, keys, indexes, relationships and restrictions, Microsoft says.
Difference Between Database Schema And ERD
The primary distinction between ERD and database schema is the degree of representation and the goal.
An ER diagram is basically a graphical data model which shows entities, attributes and relationships. The description of the database is called the database schema. It contains the actual structure and rules in the database i.e. tables, columns, data types, keys, constraints and relations.
Therefore the schema is the physical database structure whereas a model can be utilised to help build a database schema.
Conclusion
An Entity Relationship Diagram is a visual depiction of how data is arranged and related in a database. It displays entities, properties, relationships, keys and cardinality that makes it easier to organize and discuss complicated database systems.
Knowing what is ERD is useful for students, developers, database administrators and anyone learning DBMS, database architecture, or Linux database environments. Teams can identify entities and their relationships prior to implementation, leading to a better database structure with fewer possible design difficulties.
Frequently Asked Questions
1. What ERD is in DBMS?
This is a visual model that is used to depict entities, characteristics, relationships, and cardinality during the planning of the database. It helps developers understand how data should be structured before they construct database tables.
2. What is the purpose of Entity Relationship (ER) Diagram?
It is used for the database planning, data modelling, documentation, relationship analysis and communication between the technical and business departments. It can also help to discover structural problems before deployment.
3. What are ERD symbols?
Conventional symbols are rectangles for objects, ovals for attributes and diamonds for relationships. Crow’s Foot symbols or table-like entities in modern notations may be used to denote relationship cardinality.
4. What are the categories of ERD?
The common stages of modelling are conceptual, logical and physical. Conceptual models give a high level view , logical models add structural complexity , and physical models reveal implementation specifics relevant to the database .
5. What is the importance of ERD in database design?
It gives a visual picture of the database requirements and linkages. This could make it easier to plan, communicate, document and validate before a database is built.
- IBM – What Is an Entity Relationship Diagram?
Covers entities, attributes, relationships, cardinality, ERD types, and database design. IBM Entity Relationship Diagram Guide - Microsoft Learn – Design Database Diagrams
Explains tables, columns, keys, relationships, and database diagrams. Microsoft Learn – Design Database Diagrams - Microsoft Support – Create Entity Relationship Diagrams in Visio
Explains entities, attributes, relationships, and different ERD notations. Microsoft – Create Entity Relationship Diagrams in Visio - Microsoft Support – Database Model / ER Diagram
Covers database modelling, primary keys, foreign keys, relationships, and cardinality. Microsoft – Database Model and ER Diagram - IBM Documentation – Diagram Data Objects
Provides additional information about entities, relationships, optionality, and Crow’s Foot notation. IBM Documentation – Diagram Data Objects
For more helpful technology, cybersecurity, and digital-security tips, visit ExplainMeTech.com and explore our latest guides, tools, and insights.